Organizations like yours focus on making a positive change in myriad ways. Perhaps you are a grantmaker furthering sustainability, social justice, or helping those in need. Perhaps you offer scholarships or fellowships, preparing and inspiring the next generation of leaders. Or maybe you engage your community through awards, contests, or creative opportunities.
What do all these programs have in common? They make a positive impact. And to continue to be successful—raising funds, receiving donations, and attracting highly qualified applicants—program managers need the ability to demonstrate positive change through impact measurement and reporting.
Ideally, the system you use to create your impact report will aggregate data in various ways, allowing you to:
- Visualize results through charts and graphs
- Center people and their stories
- Celebrate successes
- Learn lessons for next time
- Clarify your strategy
- Build transparency and accountability
Without the right tool, however, reporting on impact can be a tricky proposition. That’s why Submittable created our latest game-changing feature, Impact Reports. With this impact measurement tool, you can survey program beneficiaries and automatically aggregate qualitative and quantitative program data—empowering you to tell your impact story.
How to create an Impact Report
Survey program beneficiaires
To gather and measure impact, you’ll want to build an impact survey that incorporates both quantitative and qualitative data.
As a best practice, consider including questions like those listed in the sample impact survey below.
Sample impact survey
Basic program information
- What type of program(s) did you run? (multiple response, e.g., community garden, urban farm, farmer’s market, etc.)
- Which best describes your program focus area? (single response, e.g., environment, health, education, etc.)
Program beneficiaries
- Which of the following populations did your program impact? (multiple response, e.g., BIPOC, youth, low-income)
- How many people were ultimately served by your program? (single response, e.g., 100 or fewer, 101-500, 501-1,000, etc.)
Program success
- How did your program track against your budget? (single response, e.g., over budget, on track, under budget, etc.)
- How did your program perform against your expectations? (single response, e.g., exceeded, met, failed to meet, etc.)
- Did you accomplish all of the goals included in your proposal? (single response, e.g., yes, no, etc.)
- Tell us more about the overall performance of your program. (long answer)
- Please share a success story from your program. (short answer)
Program learnings
- Please share a lesson you learned administering your program. (short answer)
- Are you planning on running the same program again? (single response, e.g., yes, yes with some changes, no, etc.)
- Tell us about what you will do differently next time. (short answer)
Feedback for your organization
- Did you feel adequately supported by our team? (single response, e.g., yes, somewhat, no, etc.)
- What can we do to better support you and your work? (short response)
To begin your impact report, create your survey of program beneficiaries using Submittable’s signature drag-and-drop form builder. You can include a variety of question types, including:
- Single and multiple response
- Single checkbox
- Dropdown lists
- Short and long answer fields
Impact Reports can be sent as the first form in a new Project, allowing any group of participants to fill it out (by invitation or publicly available). You can optionally include an eligibility quiz to screen those who may participate in your impact survey.
Alternatively, you can send your impact survey to applicants who have previously applied for your program via Submittable, or who were accepted or awarded funds. You can accomplish this by using Submittable’s Additional Forms.
Run your report
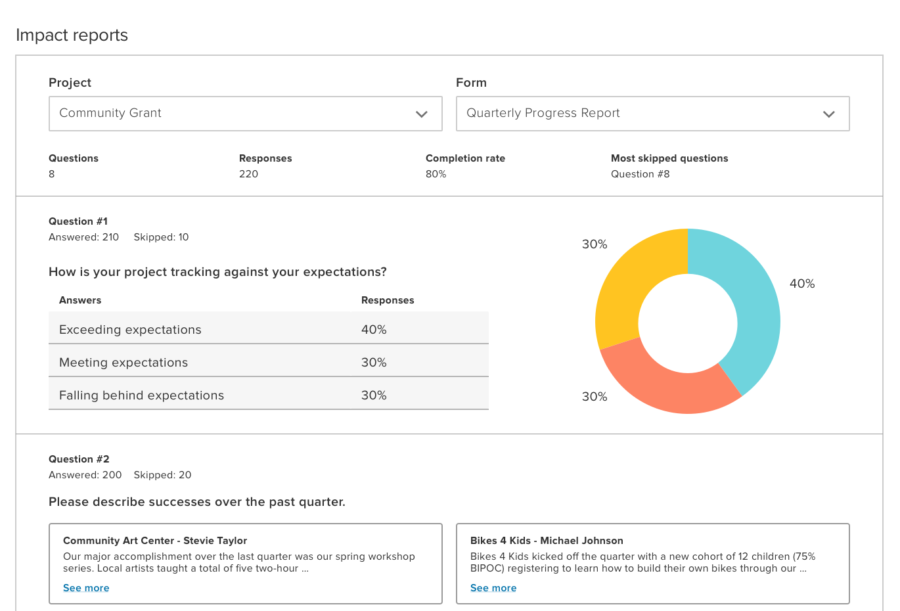
Once you’ve received responses to your impact survey, Submittable’s impact measurement tool empowers you to create a comprehensive impact report in an instant. You’ll be able to:
- Access a quick overview. See a high level overview of total questions, total responses, completion rate, and most skipped questions.
- Visualize your data. Navigate between pie charts, column charts, and bar charts, and filter responses in or out of charts.
- Scan quantitative data. Display a data table, including how many and which percentage of respondents selected each option.
- Skim narrative responses. See written answer questions aggregated for easy skimming.
How Impact Reports will help you and your team
For many, reporting on impact used to be a manual process of data analysis, involving spreadsheets and headaches. Now, it’s completely automated—you can run a quick report, and have answers at your fingertips, empowering you to:
- Get insight in an instant. What percentage of beneficiaries met their goals? How many needed more of your support, or stayed on budget? Get answers to questions like these instantly (no more exporting to Excel).
- Share results with stakeholders. Everyone is accountable to stakeholders—whether that’s your Board of Directors, funders, donors, or members of the community. Give stakeholders access to your report for streamlined transparency and accountability.
- Incorporate industry best practices. Organizations are increasingly turning to trust-based principles of philanthropy and Submittable’s Impact Reports can help. Reduce applicant burden with a centralized system, enhance transparency and responsiveness, and make it easier to act on important feedback.
- Put people first. Your programs aren’t about numbers—they’re about helping people. Gathering impact data in narrative form lets you put the stories of the real people you helped front and center.
- Visualize and analyze. Charts and graphs make it easier for humans to make sense of numbers. Play with pie, bar, and column graphs and find the best way to visualize your impact.
- Focus on what matters to you. Easily filter less important options (such as “Other” or “Not applicable”) out of your chart to highlight the most important statistics.
- Learn lessons for next time. Not every program is a success—and that’s okay! Identifying your failures gives you the insight you need to make changes and improve the next time around.
Also new from Submittable
It’s been a busy year! Submittable has recently launched new features that can revolutionize grant and CSR programs for organizations of all sizes, including:
- Funds Distribution: Save your resources to focus on running and improving your program, and leave the award disbursement to us. Through our partnership with global and domestic financial institutions, we can get payments to awardees in as little as 48 hours. All you have to do is click a button. Learn more.
- Review AI: Leverage the power of artificial intelligence to review vast numbers of applications faster and with greater accuracy. Review AI automates complicated workflows, verifies identities, and reduces fraud and the risk of misappropriation of funds. Learn more.
Our latest webinar went over these and other new features on the horizon—check it out on demand.
Learn more about Submittable
Impact Reports are just one of many ways that Submittable helps you make the biggest difference through your grant, scholarship, corporate giving or other change-making program. Learn more about how Submittable can help you launch, manage, and measure your program start to finish by contacting our team or watching a demo.
Natalya is the director of product marketing at Submittable and is focused on helping organizations get a ton of value out of the platform. She is a bookworm, adventure enthusiast and card-carrying cat lady as well as a writer and yogi.