Bring your Submittable data to life with the new Advanced Reporting feature.
Following a successful and informative limited beta release, Submittable is pleased to introduce our powerful Advanced Reporting feature to all customers. Advanced Reporting is a tool you can use to run reports on demand, making it easy to analyze your data, identify insights and trends, create charts, and measure your impact and results.
What is Advanced Reporting?
With Advanced Reporting, you can:
- Create reports on demand. Run a report based on one or more forms.
- Select data sets. You choose which data sets to include from each form, so you can be as specific or inclusive as you want.
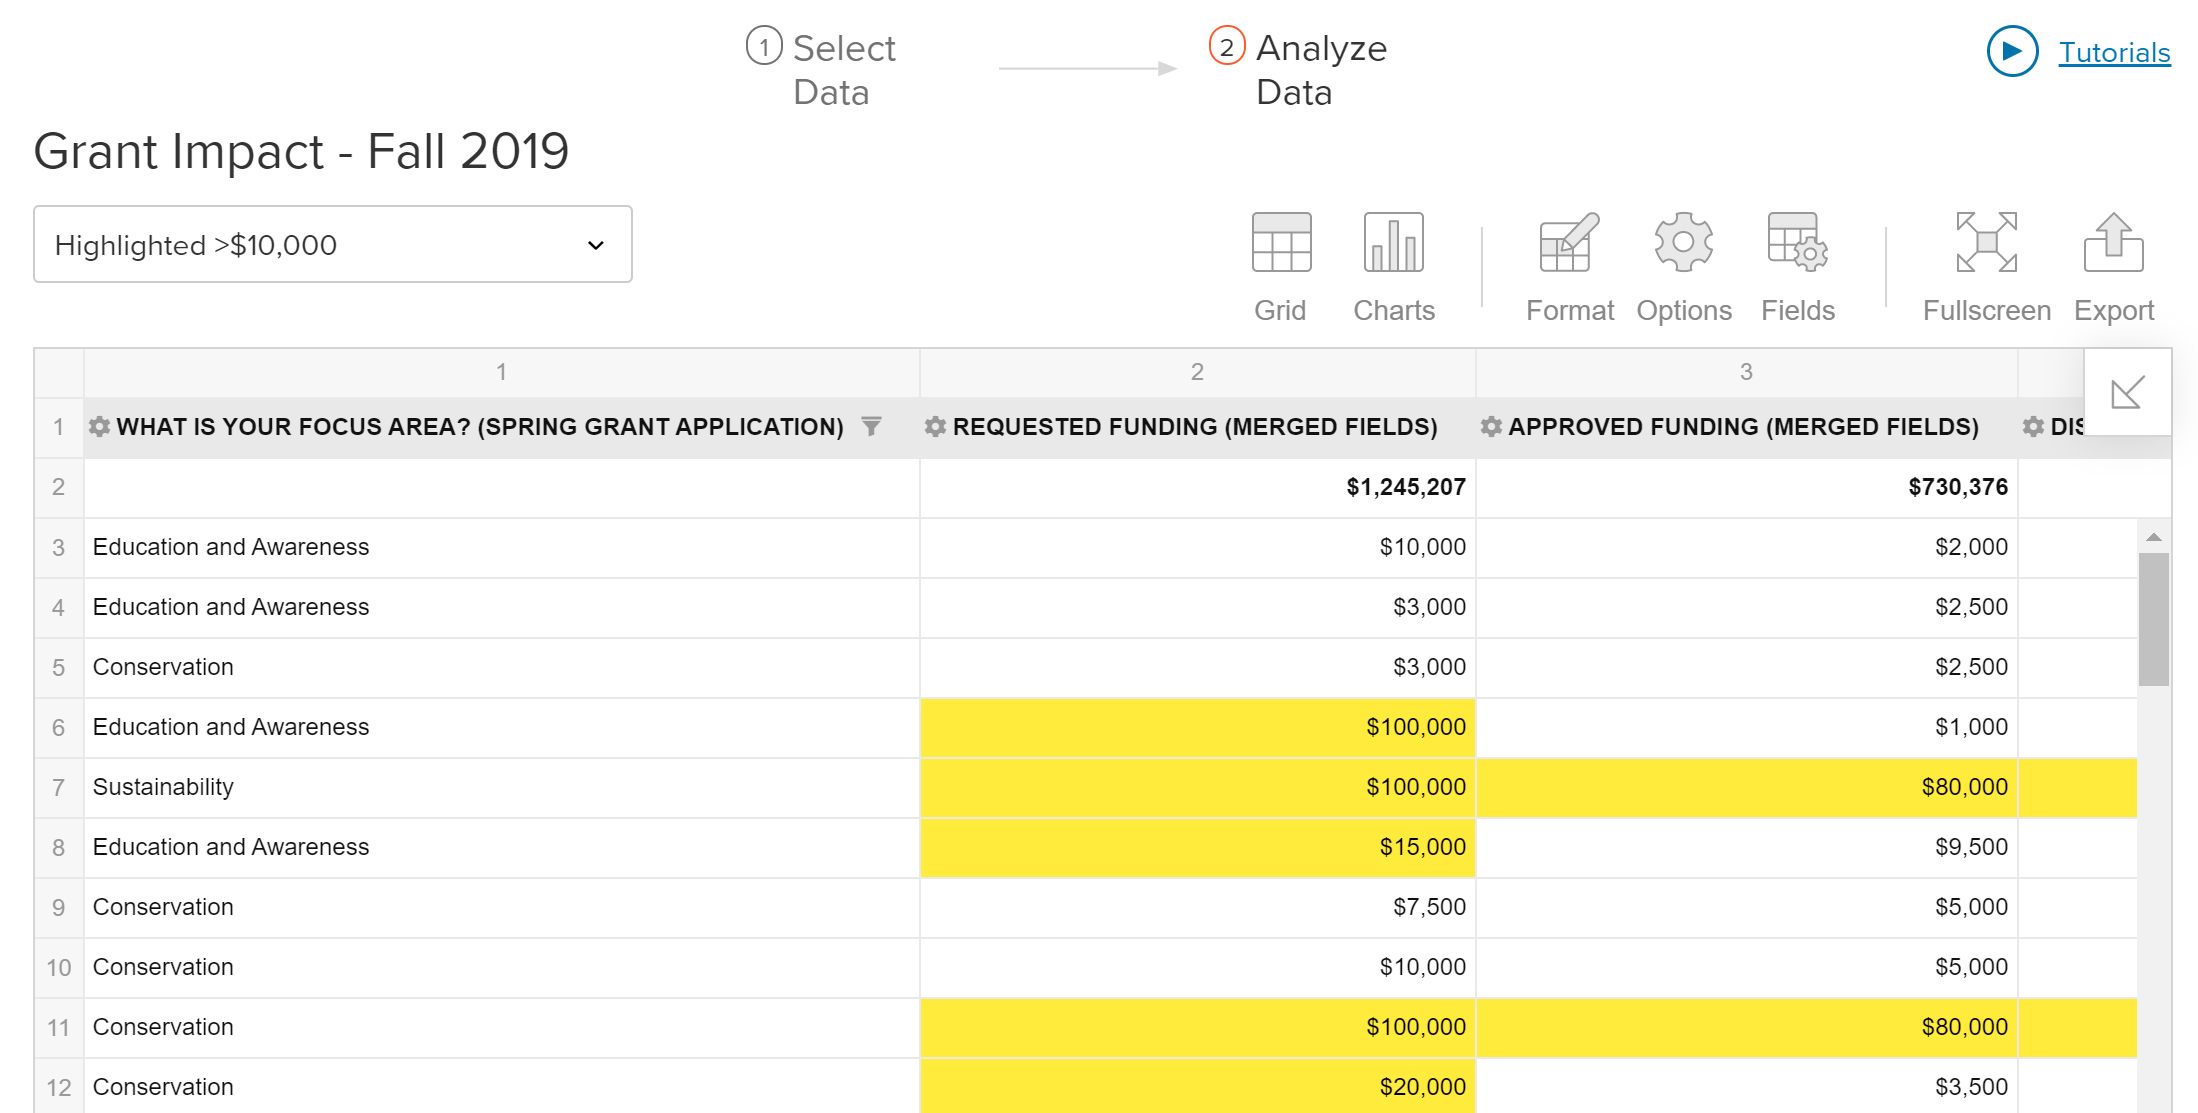
- Merge data fields. If different forms contain comparable data, you can merge them together for easier analysis.
- Apply conditional formatting. Highlight key information to make your data sets simpler to interpret, and easily find what you’re looking for.
- Filter out data. Apply filters after running a report to focus on specific pieces of information.
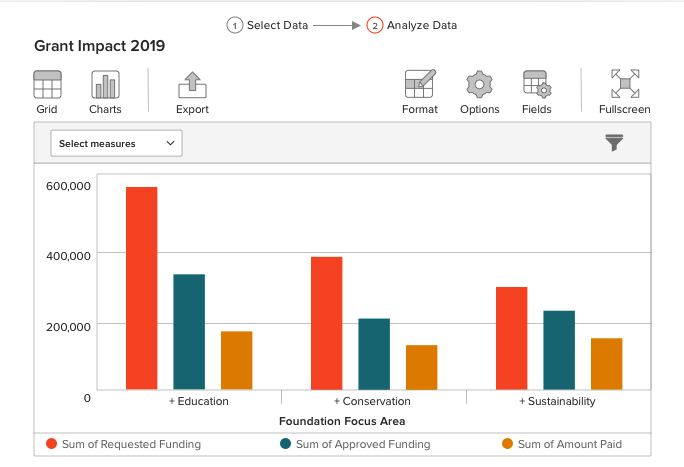
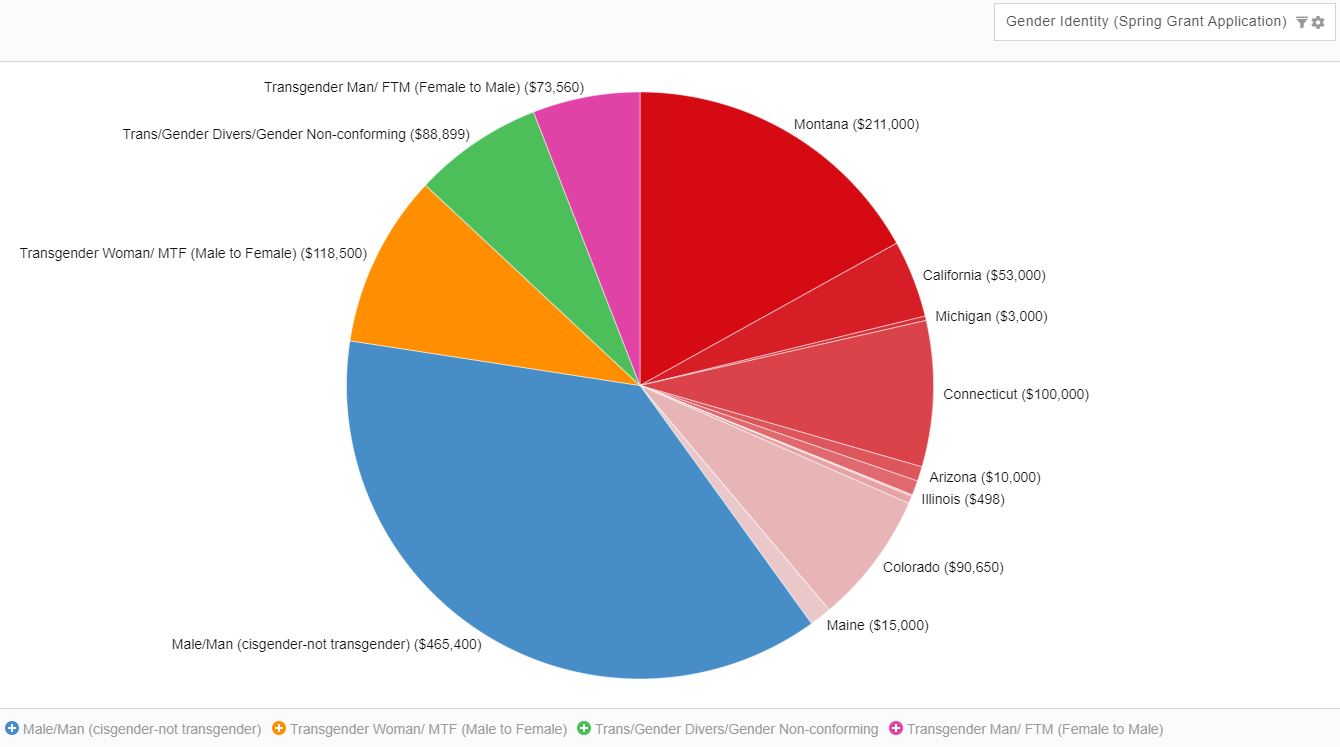
- Create charts. Pie charts, bar charts, clustered and stacked column, line graphs, and more are just a click away.
- Edit and save views. Play around with how you view your data, with pivot tables or a favorite chart, for example, and save views you find interesting to come back to them easily later.
- Easily export. Share your data or charts in an instant with export shortcuts to Excel, CSV, HTML, PDF, image, or print.
How will Advanced Reporting help me and my team?
- Dive deep into your data. Advanced Reporting puts your Submittable data at your disposal like never before, giving you the ability to analyze virtually every field from every form.
- Identify trends. Are you failing to receive a good quantity of applications, or accepting a disproportionate number of applications, from certain demographic groups? Insights such as these are waiting to be discovered.
- Answer key stakeholder questions. Be prepared to answer critical questions, regarding YoY performance for example, or about your impact across varying industries or demographic groups.
- Measure your results. Eliminate the guesswork from your decision-making and instead rely on cold, hard data.
- Visualize your impact. Not all of us are adept at interpreting spreadsheets. Creating a chart with a simple click helps you tell your story in a way that is accessible and powerful for everyone.
How do I add Advanced Reporting to my account?
Advanced Reporting is a premium feature that you can add to your account by contacting account management.
Also new at Submittable
We accomplished a lot together in 2019! If you missed our roundup of impact, new features, and more, check it out now.
You can also dive a little deeper into some of the new features we introduced last year, including Funds and Review Workflow, in our Q4 2019 Product Roundup webinar, the first in a new series.

Natalya is a product marketer at Submittable focused on helping organizations get a ton of value out of the platform. She is a bookworm, adventure enthusiast and card-carrying cat lady as well as a writer and yogi.